V8 VSCode Debugging
A small guide to debug V8 Source Code using VSCode
Motivation
When auditing or researching V8, being able to step through the engine in a debugger is often more valuable than static code reading alone. This guide provides a concise walkthrough for debugging the V8 source code using VSCode, aimed at researchers who want to analyze engine behavior, validate assumptions, and speed up vulnerability discovery.
Context & Setup
1) Firstly, compile V8, Refer Building V8 from source and Building V8 with GN for full guide.
2) Once built, open the V8 source code in VSCode.
3) Make sure you have the C/C++ Extension installed from the VSCode Extension Store (since we’ll be using cppdbg for debugging).
4) Add launch.json to .vscode folder. You can add multiple configs in the array. To run a js program:
1
2
3
4
5
6
7
8
9
10
11
12
13
14
15
16
17
18
19
20
21
22
23
24
25
// Running a js program
{
  "version": "0.2.0",
  "configurations": [
  {
    "name": "v8 PoC Testing",
    "type": "cppdbg",
    "request": "launch",
    "targetArchitecture": "x64",
    "program": "${workspaceRoot}/out/x64.debug/d8",  // You can use absolute path here as well
    "args": ["--allow-natives-syntax","<OTHER FLAGS>","<ABSOLUTE PATH TO JS FILE>"],  // Optional command line args + d8 flags
    "stopAtEntry": true,
    "cwd": "${workspaceRoot}",

    // use lldb or gdb to debug
    //"MIMode": "lldb",
    "MIMode": "gdb",

    // set up source file map to solve the `Could not load source ... 'SourceRequest' not supported..` problem
    // @see <https://github.com/microsoft/vscode-cpptools/issues/3831>

    // "cwd": "${workspaceRoot}/out/x64.debug",
    "sourceFileMap": { "../../": "${workspaceRoot}" }  // You can use absolute path here as well
  }]
}
Some things to note here. There are many options above you can change based on your specific system such as the target architecture, program name, args, the debugger to use (for Linux:gdb, for Mac:lldb), and most importantly the source file map. We must this config sourceFileMap to make sure the source mapping works. Because the v8 source directory is ${workspaceRoot} and the program is in ${workspaceRoot}/out/x64.debug, so we can set it to :
1
"sourceFileMap": { "../../": "${workspaceRoot}" }
Although you can also set it to absolute paths as well if you wish (or the above doesn’t work out) -
1
"sourceFileMap": { "<FULL PATH TO V8 SOURCE>": "<FULL PATH TO V8 SOURCE>" }
Additionally, you can check out https://github.com/microsoft/vscode-cpptools/issues/3831 and https://code.visualstudio.com/docs/cpp/cpp-debug#_locate-source-files for more details. You can also set the stopAtEntry configuration. If set to true, it will set the first breakpoint to the entry point in V8 (which is in Shell::Main in d8.cc). If set to false, it will continue until it encounters a user defined breakpoint (if you have set any).
4) Now that we are done with the settings, switch to the debugging tab in VSCode (present in the left column tab). You can select the debug config from the top dropdown (if you have multiple entries in launch.json). You can also now set breakpoints in the code wherever you wish.
Once done, you can start the source level debugging. This is how it would look like -
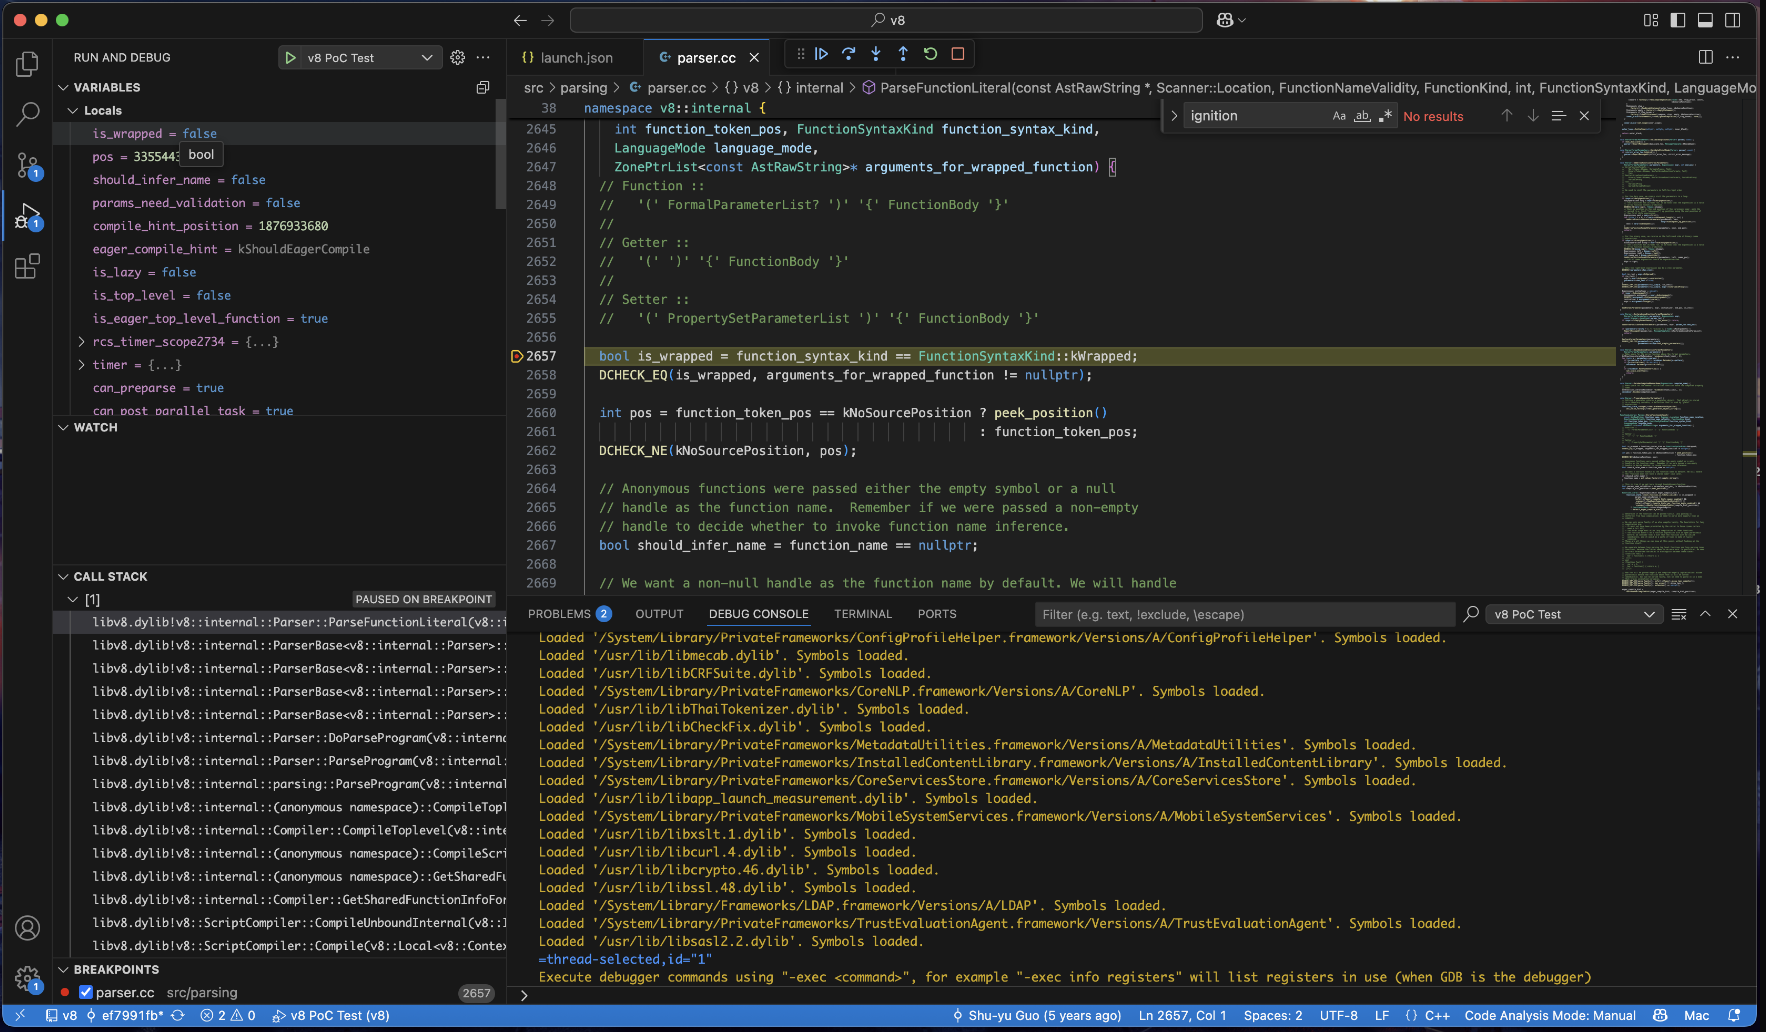
That’s it! :)
Credits
Hey There! If you’ve come across any bugs or have ideas for improvements, feel free to reach out to me on X! If your suggestion proves helpful and gets implemented, I’ll gladly credit you in this dedicated Credits section. Thanks for reading!